Learning from training data
A key concept in machine learning is using a subset of a dataset to train an algorithm to make estimates on a separate set of test data. The quality of the machine learning and algorithm can be assesed based on the accuracy of the predictions made on test data. Many times there are also parameters sometimes termed hyper-parameters which can be optimized through an iterative approach on test or validation data. In practice a dataset is randomly split into training and test sets using sampling.
k nearest neighbor
We will examine one machine learning algorithm in the laboratory, k nearest neighbor. Many of the concepts are applicable to the broad range of machine learning algorithms available.
Nearest neighbor concept
The training examines the characteristics of k nearest neighbors to the data point for which a prediction will be made. Nearness is measured using several different metrics with Euclidean distance being a common one for numerical attributes.
Euclidean distance:
1-D:
2-D:
For multiple points (rows, multidimensional):
import numpy as np
from datascience import *
import matplotlib
%matplotlib inline
import matplotlib.pyplot as plt
plt.style.use('ggplot')
Distance function inspired from above equations (1-3).
def distance(pt1, pt2):
    """The distance between two points, represented as arrays."""
    return np.sqrt(np.sum((pt2-pt1)**2))
Nearest neighbor Functions
These cells create the complete algorithm and use as part of a nearest neighbor toolbox
def row_distance(row1, row2):
    """The distance between two rows of a table."""
    return distance(np.array(row1), np.array(row2)) # Need to convert rows into arrays

def distances(training, test, target, features):
    """Compute the distance from test for each row in training."""
    dists = []
    attributes = training.select(features)
    for row in attributes.rows:
        dists.append(row_distance(row, test))
    return training.with_column('Distance', dists)

def closest(training, test, k, target, features):
    """Return a table of the k closest neighbors to example row from test data."""
    return distances(training, test, target, features).sort('Distance').take(np.arange(k))
Prediction Functions
def predict_knn(row, train, test, k=5, pr=False):
    """Return the predicting value or class among the
     k nearest neighbors, pr=1 prints"""
    if pr:
            print(f'Predicting target value, {target[0]}, for row = {row} using k={k} with features: {features}')
    return np.average(closest(train, test.select(features).row(row), k , target, features).column(target[0]))
def predict_knn_class(row, train, test, k=5, pr=False):
"""Return the predicting value or class among the
k nearest neighbors, pr=1 prints"""
closestclass = list(closest(train, test.select(features).row(row), k , target, features).column(target[0]))
if pr:
print(f'Predicting target value, {target[0]}, for row = {row} using k={k} with features: {features}')
print(f'Actual classification: {test.select(target).take(row)[0][0]}')
print(f'Predicted classification: {max(closestclass, key=closestclass.count)}')
print(f'Closest classifications: {closestclass}')
return max(closestclass, key=closestclass.count)Regression Functions
Use as part of a toolbox for later analysis and the project
def standard_units(any_array):
    "Convert any array of numbers to standard units."
    return (any_array - np.mean(any_array))/np.std(any_array)

def correlation(t, label_x, label_y):
    """Compute the correlation between two variables from a Table with column label_x and label_y.."""
    return np.mean(standard_units(t.column(label_x))*standard_units(t.column(label_y)))

def slope(t, label_x, label_y):
    """Compute the slope between two variables from a Table with column label_x and label_y."""
    r = correlation(t, label_x, label_y)
    return r*np.std(t.column(label_y))/np.std(t.column(label_x))

def intercept(t, label_x, label_y):
    """Compute the slope between two variables from a Table with column label_x and label_y."""
return np.mean(t.column(label_y)) - slope(t, label_x, label_y)*np.mean(t.column(label_x))CKD=Table().read_table('data/ckd.csv')
CKDDefine target and features
target = ['Class']
features = ['Blood Pressure','Blood Glucose Random','Hemoglobin','Serum Creatinine' ]
sCKD = CKD.select(target[0])Standardize
for label in features:
    print('Standardizing: ',label)
    sCKD = sCKD.with_columns(label,standard_units(CKD[label]))
sCKD
Standardizing: Blood Pressure
Standardizing: Blood Glucose Random
Standardizing: Hemoglobin
Standardizing: Serum Creatinine
Train, test split
trainK, testK = sCKD.split(int(0.8*CKD.num_rows))
print(trainK.num_rows, 'training and', testK.num_rows, 'test instances.')
trainK.show(3)126 training and 32 test instances.
predict_knn_class(16, trainK, testK, k=8, pr=True)Predicting target value, Class, for row = 16 using k=8 with features: ['Blood Pressure', 'Blood Glucose Random', 'Hemoglobin', 'Serum Creatinine']
Actual classification: 0
Predicted classification: 0
Closest classifications: [0, 0, 0, 0, 0, 0, 0, 0]
0Test prediction accuracy using specified features
correct = 0
predict_list = []
for i in np.arange(testK.num_rows):
predict = predict_knn_class(i, trainK, testK, k=8, pr=False)
predict_list.append(predict)
correct += 1*(predict == testK[target[0]][i])
print(f'Percent correct: {correct/testK.num_rows*100:.1f}%')Percent correct: 100.0%
Convert test data to original units and plot using below functions
Examine relationship between two variables and prediction (0 = no CKD, 1 = CKD)
def original_val(x_z,xmean,xstd):
"""Convert standard z-value back to original"""
x = x_z*xstd + xmean
return xdef plot_relate(tbl, test, predict_list, labelx, labely):
"""Plot prediction in original units"""
testvals = Table().with_columns(target[0],testK[target[0]], 'predict',predict_list)
for label in features:
xmean = np.mean(tbl[label])
xstd = np.std(tbl[label])
x = original_val(test[label],xmean,xstd)
testvals=testvals.with_columns(label,x)
scatter = plt.scatter(testvals[labelx],testvals[labely], c=testvals['predict'])
plt.xlabel(labelx)
plt.ylabel(labely)
plt.legend(*scatter.legend_elements())
return testvals
plot_relate(CKD, testK, predict_list, "Blood Glucose Random", "Hemoglobin")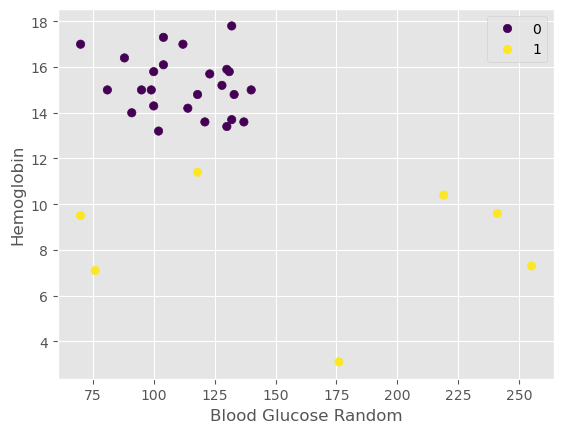
Interpretation: Patients with high hemoglobin numbers and low blood glucose are less likely to be predicted to have CKD
plot_relate(CKD, testK, predict_list, "Blood Glucose Random", "Serum Creatinine")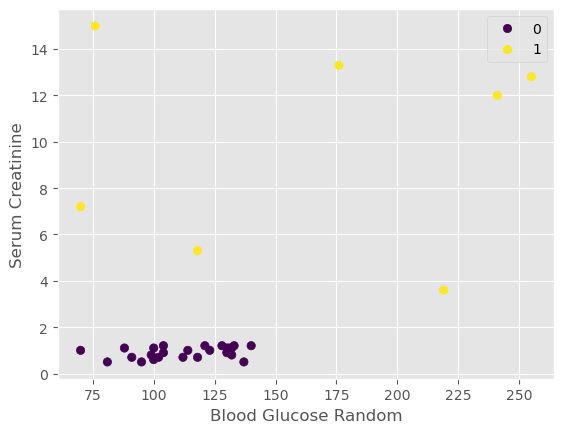
Interpretation: Patients with low creatinine and blood glucose are less likely to be predicted to have CKD
Pretty good prediction, let’s see if we can do better with additional features
Add additional features
features['Blood Pressure', 'Blood Glucose Random', 'Hemoglobin', 'Serum Creatinine']target = ['Class']
features = ['Age','Blood Pressure','Blood Glucose Random','Hemoglobin','Serum Creatinine', 'Sodium', 'Blood Urea' ]sCKD = CKD.select(target[0])for label in features:
print('Standardizing: ',label)
sCKD = sCKD.with_columns(label,standard_units(CKD[label]))
sCKD Standardizing: Age
Standardizing:  Blood Pressure
Standardizing:  Blood Glucose Random
Standardizing:  Hemoglobin
Standardizing:  Serum Creatinine
Standardizing: Sodium
Standardizing: Blood Urea
trainK, testK = sCKD.split(int(0.8*CKD.num_rows))
print(trainK.num_rows, 'training and', testK.num_rows, 'test instances.')

trainK.show(3)
126 training and 32 test instances.
Test prediction accuracy using specified features
correct = 0
predict_list = []
for i in np.arange(testK.num_rows):
    predict = predict_knn_class(i, trainK, testK, k=8, pr=False)
    predict_list.append(predict)
    correct += 1*(predict == testK[target[0]][i])
print(f'Percent correct: {correct/testK.num_rows*100:.1f}%')
Percent correct: 90.6%
plot_relate(CKD, testK, predict_list, "Blood Urea", "Sodium")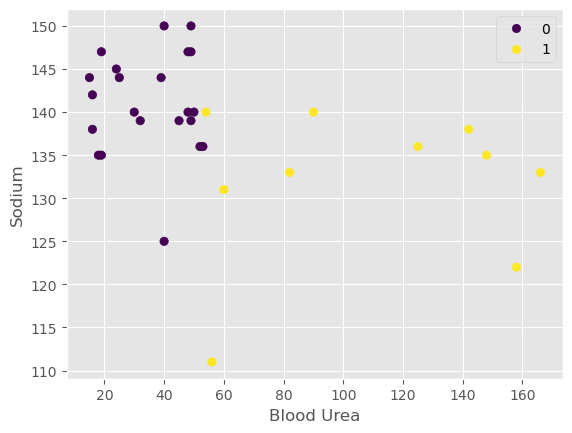
Interpretation: Patients with high sodium and low urea are less likely to be predicted to have CKD
Improved...