Is white wine more acidic due to fermentation without skins? Hypothesis testing example: Difference of means
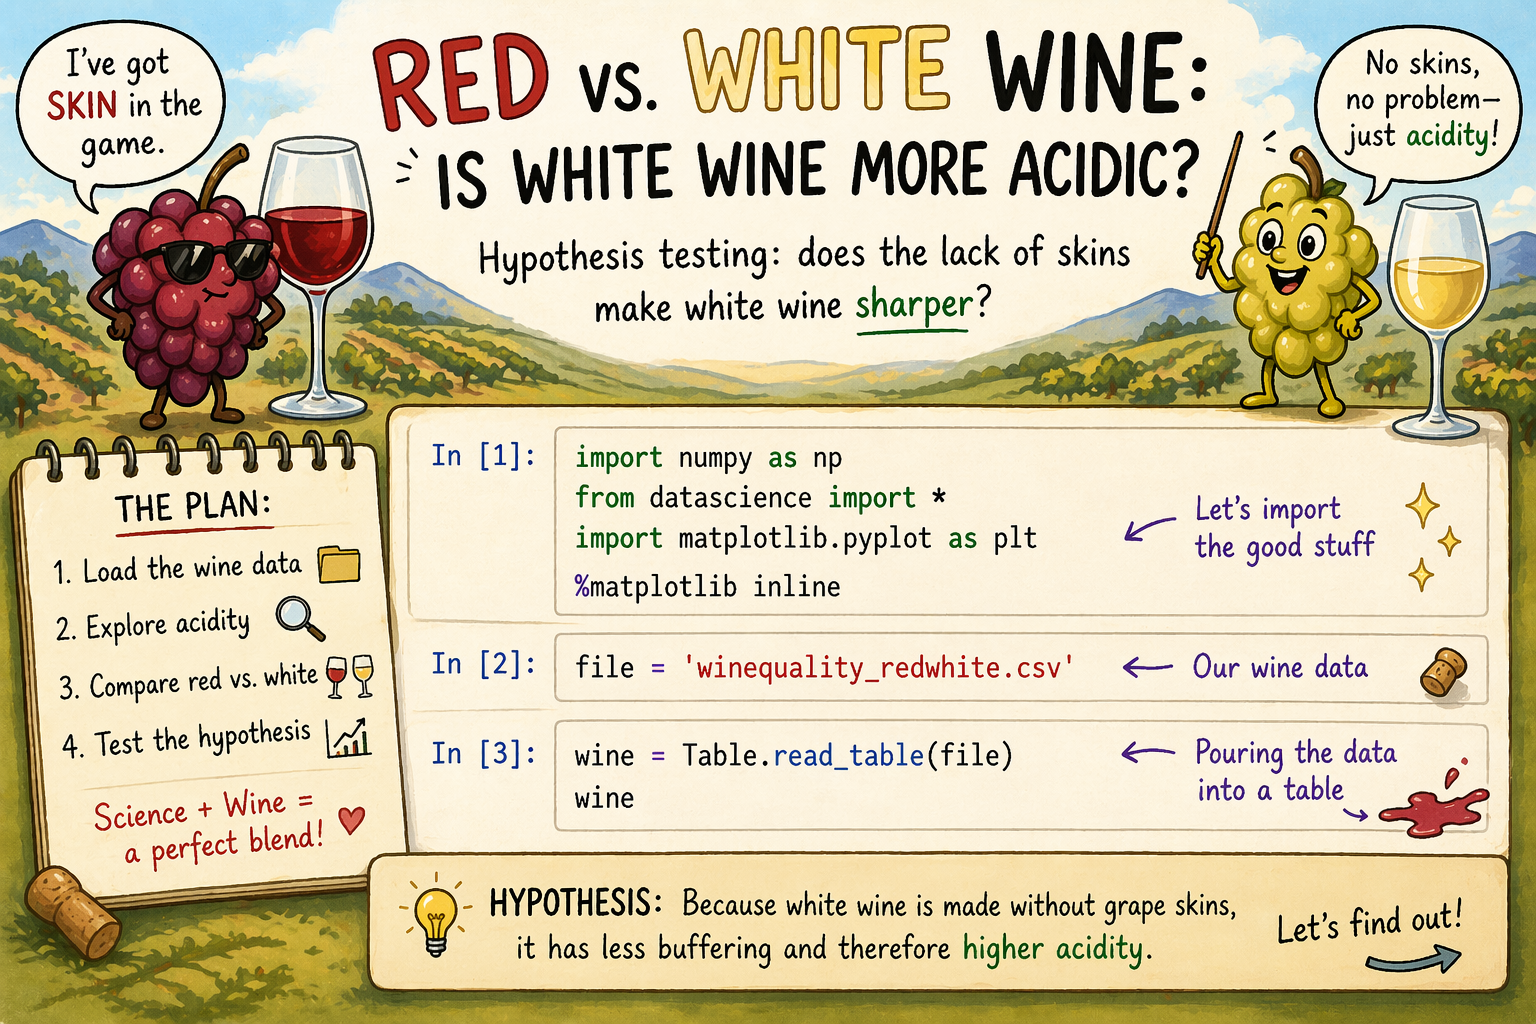
import numpy as np
from datascience import *
import matplotlib.pyplot as plt
%matplotlib inline
file = 'winequality_redwhite.csv'wine = Table.read_table(file)
wineLoading...
wine.group('type')Loading...
Hypothesis
White wines are more acidic than red
Why: White wines are usually fermented without skins, emphasizing acidity, while red wines are fermented with skins and seeds, imparting tannins that can mask the perception of acidity. Lodi Growers
Null hypothesis
Difference in pH between individaul red and white wines is random
wine_group = wine.group('type',np.mean)
wine_group
Loading...
Difference of means
use index [1] and [0] to access elements of array created from column
pHdiff = wine_group.column('pH mean')[1] - wine_group.column('pH mean')[0]
pHdiff-0.12284655630267016White has lower pH which means more acidic
Simulate Null Distribution
pHdiff_sim = []

for i in np.arange(300):
    wine_group_s = wine.sample().group('type',np.mean)
    sim_diff = wine_group_s.column('pH mean')[1] - wine_group_s.column('pH mean')[0]
    pHdiff_sim.append(sim_diff)
len(pHdiff_sim)300plt.hist(pHdiff_sim)
plt.axvline(pHdiff)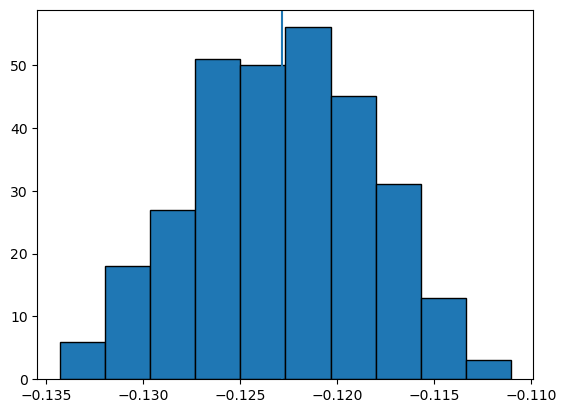
p = np.count_nonzero( np.array(pHdiff_sim) >= 0 )/len(pHdiff_sim)
p0.0p < 0.05 Data suports Hypothesis, discard Null hypothesis
Alternate Simulation of Null Distribution
pHdiff_sim = []
winetype = wine.column('type')
for i in np.arange(300):
winetype_s = np.random.shuffle(winetype)
wine_s = wine.with_column('Stype',winetype_s)
wine_group_s = wine_s.group('type',np.mean)
sim_diff = wine_group_s.column('pH mean')[1] - wine_group_s.column('pH mean')[0]
pHdiff_sim.append(sim_diff)
plt.hist(pHdiff_sim)(array([ 2., 5., 9., 17., 45., 68., 66., 49., 25., 14.]),
array([-0.01543567, -0.01281095, -0.01018624, -0.00756152, -0.00493681,
-0.00231209, 0.00031262, 0.00293734, 0.00556205, 0.00818677,
0.01081148]),
<BarContainer object of 10 artists>)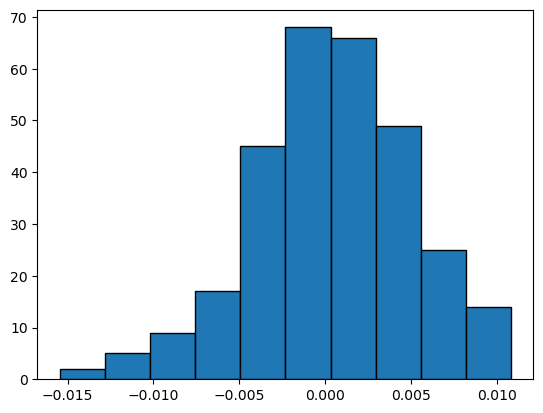
plt.hist(pHdiff_sim)
plt.axvline(pHdiff)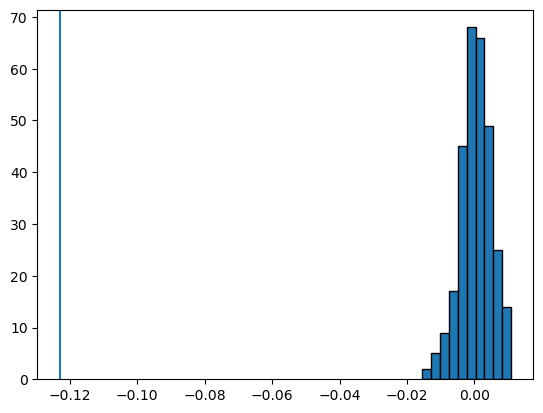
p = np.count_nonzero( pHdiff_sim <= pHdiff )/len(pHdiff_sim)
p
0.0